Understanding top command
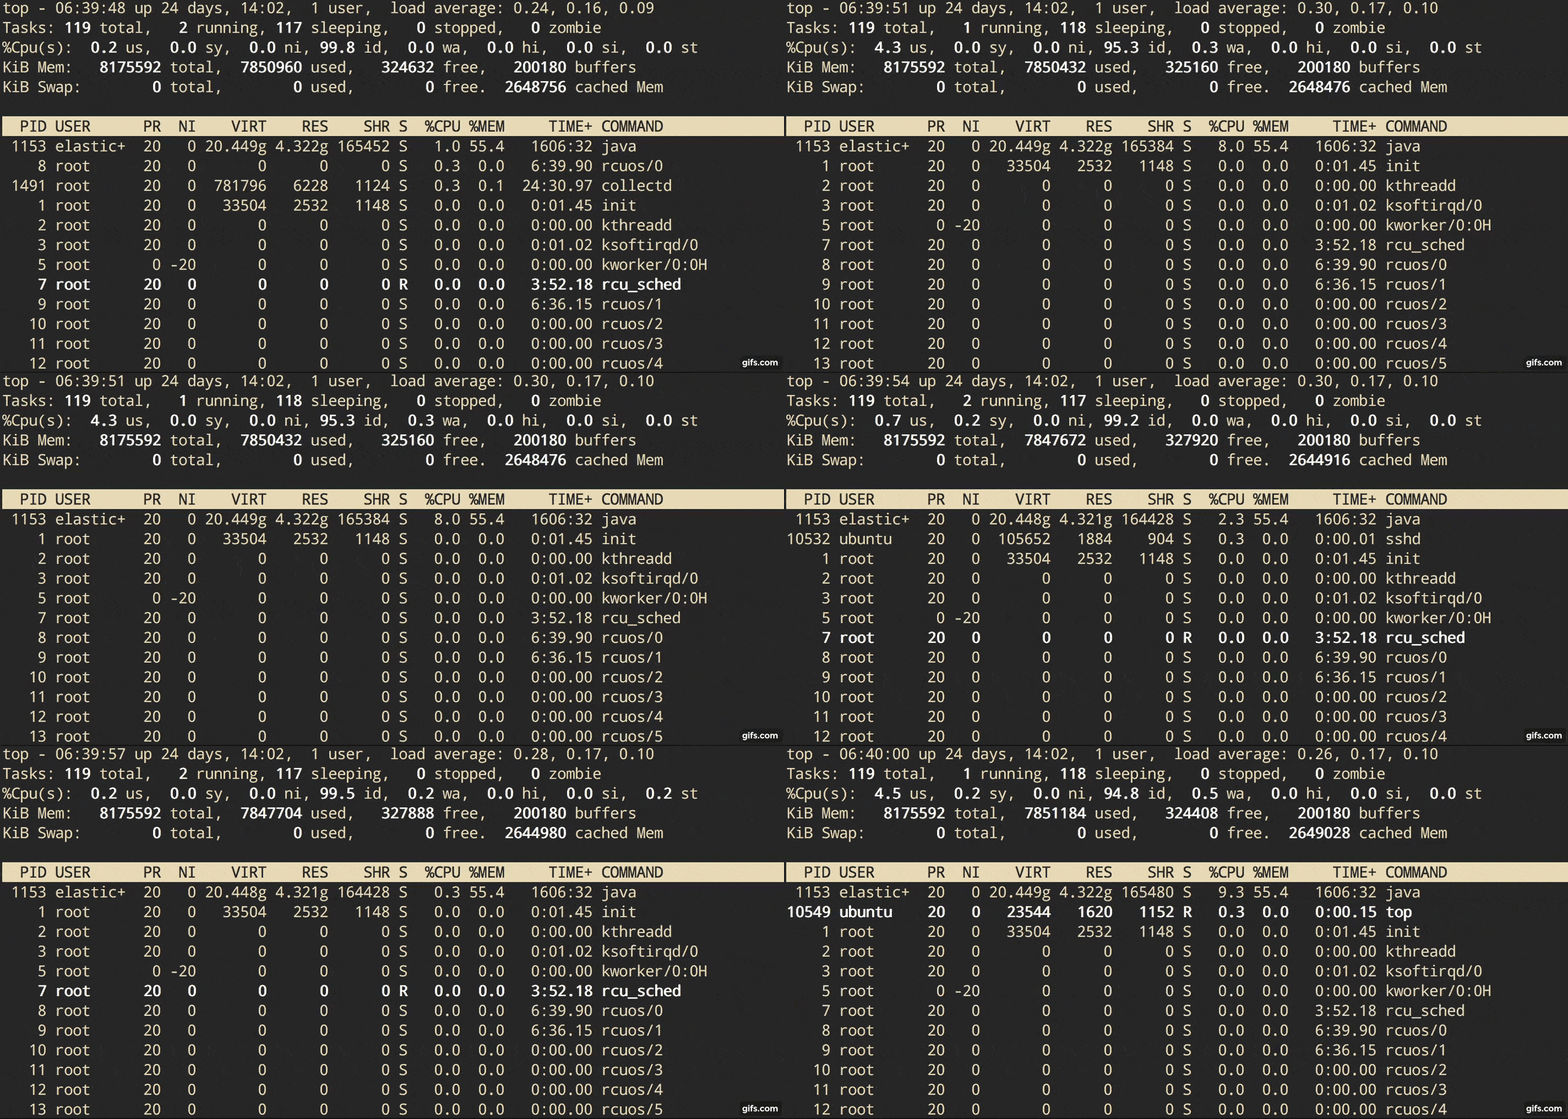
top is a monitoring program which is used frequently for tracking process’s resource usage and its activity in real-time, show current tasks being serviced by the kernel, help discovering and diagnosing overload or capacity of system by seeing CPU & Mem usage. It’s available under many Unix/Linux operating systems.
Keyword: top, uptime, users, load average, process/thread state, CPU operation

Description from man page:
The top program provides a dynamic real-time view of a running system. It can display system summary information as well as a list of processes or threads currently being managed by the Linux kernel. The types of system summary information shown and the types order and size of information displayed for processes are all user configurable and that configuration can be made persistent across restarts.
The program provides a limited interactive interface for process manipulation as well as a much more extensive interface for personal configuration - encompassing every aspect of its operation. And while top is referred to throughout this document, you are free to name the program anything you wish. That new name, possibly an alias, will then be reflected on top’s display and used when reading and writing a configuration file. …
❯❯ Need more? See http://man7.org/linux/man-pages/man1/top.1.html
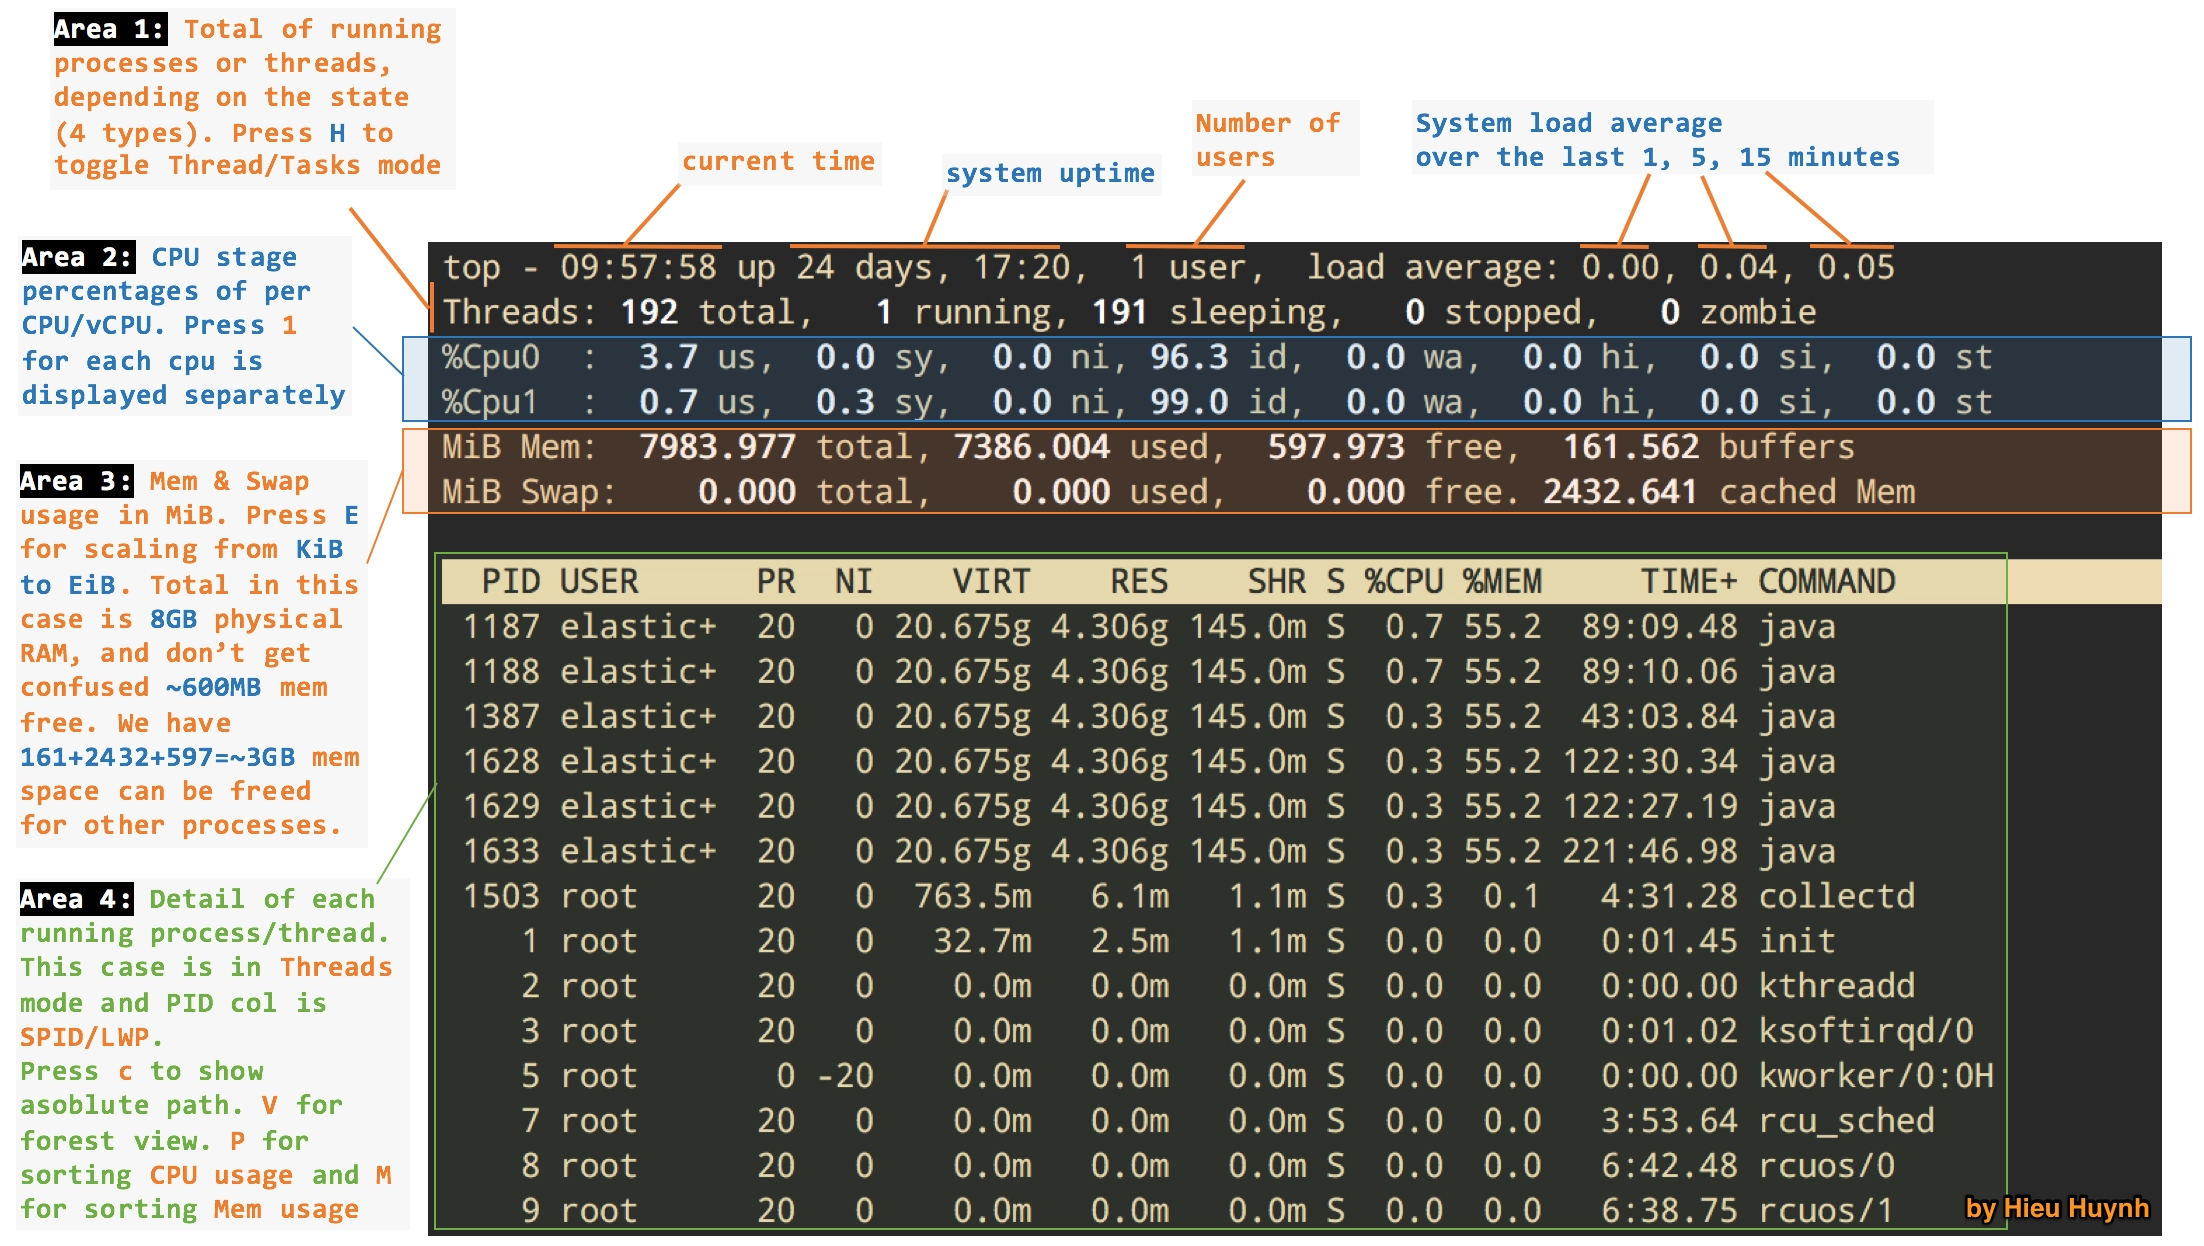
But it’s too fucking long 💢 and want to see the whole picture? 🌟 Sure, I have a picture below
Understanding top command

1. Date and uptime
Current time is 13:41, and system has been running for over 5 weeks, from last boot on May 17
top - 13:41:31 up 38 days, 21:04,  3 users,  load average: 0.01, 0.09, 0.13
❯❯ date
Sun Jun 25 13:41:31 UTC 2017
❯❯ uptime
13:41:31 up 38 days, 21:04,  3 users,  load average: 0.01, 0.09, 0.13
❯❯ uptime -p
up 5 weeks, 3 days, 21 hours, 6 minutes
❯❯ uptime -s
2017-05-17 16:37:26
2. Number of logged users
I have 3 logged users and what they are doing:
- one is running ssh to other
- one is on bash shell
- and … me with
wcommand
3 users
❯❯ w
 13:41:31 up 38 days, 21:04,  3 users,  load average: 0.00, 0.01, 0.05
USER     TTY      FROM             LOGIN@   IDLE   JCPU   PCPU WHAT
ubuntu   pts/0    x.205.x.xxx      13:09    1:34   0.07s  0.03s ssh abc.xyz
ubuntu   pts/3    x.64.xx.xxx      05:11    8:36m  0.05s  0.01s -bash
ubuntu   pts/6    x.161.x.xxx      13:47    3.00s  0.04s  0.00s w
3. Load average
The load average is a number corresponding to the average number of runnable processes on the system. The load average is often listed as three sets of numbers, which represent the load average for the past 1, 5, and 15 minutes. - from RedHat
On Linux systems, these numbers include processes wanting to run on CPU, as well as processes blocked in uninterruptible I/O (usually disk I/O). This gives a high level idea of resource load (or demand). The three numbers give us some idea of how load is changing over time. For example, if you’ve been asked to check a problem server, and the 1 minute value is much lower than the 15 minute value, then you might have logged in too late and missed the issue - from Netfilx Techblog
Runable processes means: running and blocked processes (usually by I/O). That’s really important because it means that you can have 0% CPU usage and still have high load. The processes blocked on I/O show up in the “D” state in ps, header “STAT” or “S”
Lower numbers are better than higher numbers. If the third number is too high (15 minutes ago), I think we got a problem about the performance to deal with. But what’s the Threshold, what’s too high. We need a reasonable and acceptable value for comparison.
3.1 Single logical CPU
In general, with one logical CPU - 1 vCPU, Threshold = 0.7 is a best practice, many sysadmins will draw a line at 0.70.
For example in case of 1 vCPU:
load average: 1.25, 0.60, 4.20
- over the last 1 minute: System was overloaded by
25% on average. 0.25 processes were waiting for the CPU - over the last 5 minutes: CPU
idled for 40%of the time. It’s acceptable - over the last 15 minutes: System was
overloaded by 320%on average. 3.20 processes were waiting for the CPU.
3.2 Multi-logical CPUs
With 4 logical CPUs system? It’s still healthy with a load of 2.80 - 3.00. On multi-logical CPUs system, the load is relative to the number of vCPUs available.
The “100% utilization” mark is 1.00 on a single-logical CPU system, 2.00, on a dual vCPUs, 4.00 on a quad-vCPUs, etc.
In top command, press 1 for each vCPU is displayed seperately, also to know number of vCPU.
I have 4 vCPUs in this case, using EC2 AWS C4 type, low load average
top - 09:10:00 up 32 days, 6 min,  2 users,  load average: 0.01, 0.04, 0.05
Tasks: 125 total,   1 running, 124 sleeping,   0 stopped,   0 zombie
%Cpu0  :  0.7 us,  0.0 sy,  0.0 ni, 99.3 id,  0.0 wa,  0.0 hi,  0.0 si,  0.0 st
%Cpu1  :  0.0 us,  0.3 sy,  0.0 ni, 99.7 id,  0.0 wa,  0.0 hi,  0.0 si,  0.0 st
%Cpu2  :  0.0 us,  0.0 sy,  0.0 ni,100.0 id,  0.0 wa,  0.0 hi,  0.0 si,  0.0 st
%Cpu3  :  5.0 us,  0.3 sy,  0.0 ni, 94.6 id,  0.0 wa,  0.0 hi,  0.0 si,  0.0 st
Something more:
- 💢 Confusing about vCPUs/cores/threads - See CPU Architecture fundamental
- 🌟 For deep understanding about load average - See this post
- 🌟 For another example - See wiki
- 🌟 Case: High load average but low CPU ultilization - See this post
4. Process/Thread state
Let’s focus on Area1 in that overview picture above. In that top area, top shows the total number of processes and how many of them are running. But it says Tasks not Processes. Because another name for a process is a task. The Linux kernel internally refers to processes as tasks.
Tasks: 283 total, 1 running, 282 sleeping, 0 stopped, 0 zombie
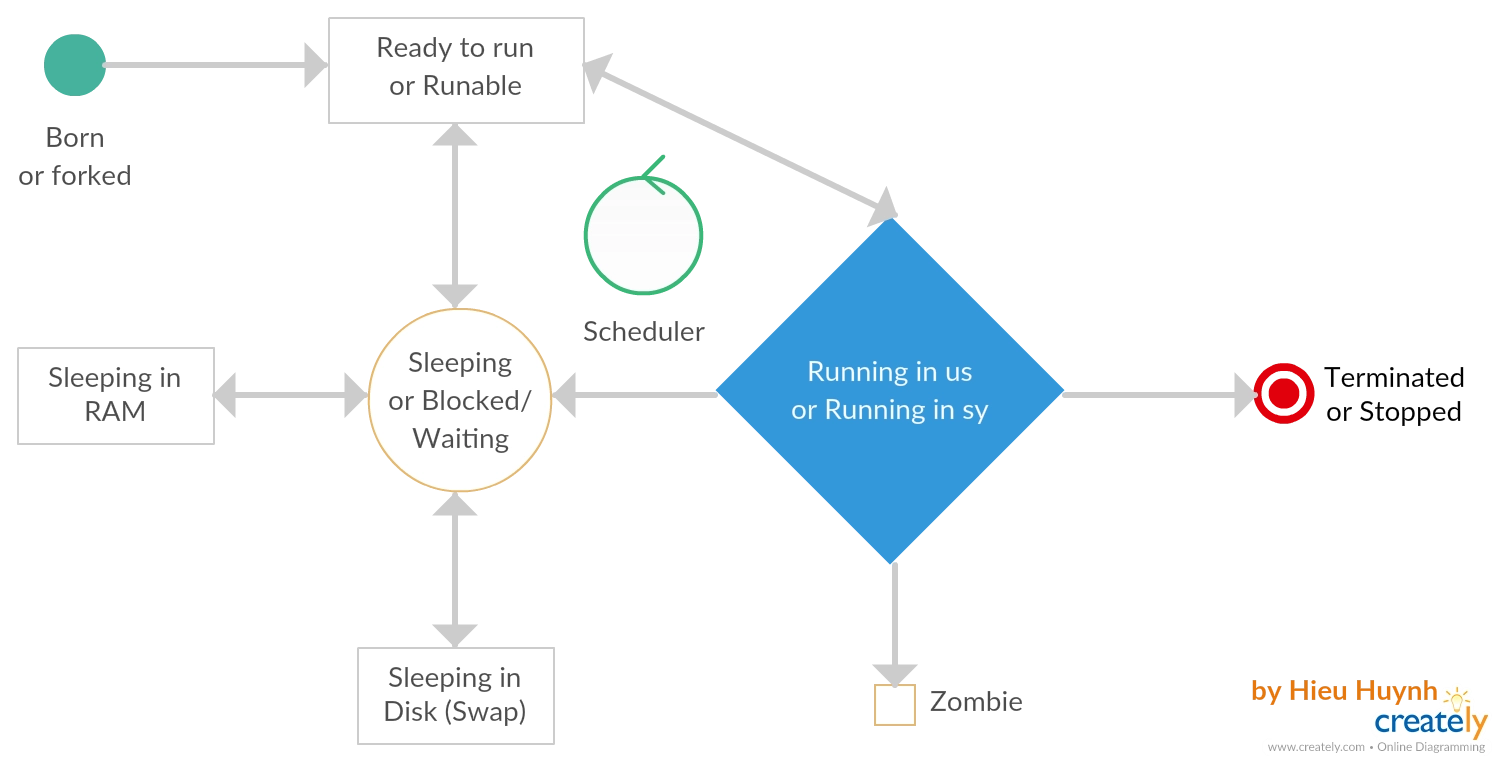
From the time a process is born to when it is terminated, the process proceeds through various states. Those states can include Runnable, Running, Sleeping (in memory and on disk), and Zombie states - from Redhat

4.1 Runable state
When a process is in a Runnable state, it means it has all the resources it needs to run, except that the CPU is not available.
For example: A process is dealing with I/O, so it does not immediately need the CPU, when the process finishes the I/O operation, a signal is generated to the CPU and the scheduler keeps that process in the run queue (the list of ready-to-run processes maintained by the kernel) - Runable. When the CPU is available, this process will enter into Running state
4.2 Running state
The process that is executing and using the CPU at a particular moment is called a Running process.
A CPU can execute either in kernel mode (sy) or in user mode (us). When a user initiates a process, the process starts working in user mode. That user mode process does not have access to kernel data structures or algorithms. Each CPU type provides special instructions to switch from user mode to kernel mode - they’re system calls
System calls: communication chanel between user space program and kernel
4.3 Sleeping state
A process enters a Sleeping state when it needs resources that are not currently available. At that point, it either goes voluntarily into Sleep state or the kernel puts it into Sleep state. Going into Sleep state means the process immediately gives up its access to the CPU.
When the resource the process is waiting on becomes available, a signal is sent to the CPU. The next time the scheduler gets a chance to schedule this sleeping process, the scheduler will put the process either in Running or Runnable state
4.4 Terminated/Stopped state
Processes can end when they call the exit system themselves or receive signals to end. We use kill -9 <PID> to kill a process.
See more at Signals
4.5 Zombie state
When a process dies on Linux, it isn’t all removed from memory immediately — its process descriptor stays in memory (the process descriptor only takes a tiny amount of memory). The process’s status becomes EXIT_ZOMBIE and the process’s parent is notified that its child process has died with the SIGCHLD signal. The parent process is then supposed to execute the wait() system call to read the dead process’s exit status and other information. This allows the parent process to get information from the dead process. After wait() is called, the zombie process is completely removed from memory.
This normally happens very quickly, so you won’t see zombie processes accumulating on your system. However, if a parent process isn’t programmed properly and never calls wait(), its zombie children will stick around in memory until they’re cleaned up. - from here
Zombies that exist for more than a short period of time typically indicate a bug in the parent program, or just an uncommon decision to not reap children (see example). If the parent program is no longer running, zombie processes typically indicate a bug in the operating system. - from Wiki
Here are the different values that the s, stat and state output specifiers (header “STAT” or “S”) will display to describe the state of a process:
- D: uninterruptible sleep (usually IO)
- R: running or runnable (on run queue)
- S: interruptible sleep (waiting for an event to complete)
- T: stopped by job control signal
- t: stopped by debugger during the tracing
- W: paging (not valid since the 2.6.xx kernel)
- X: dead (should never be seen)
- Z: defunct (“zombie”) process, terminated but not reaped by its parent
See state of all processes by using ps -el command.
❯❯ ps -el
F S   UID   PID  PPID  C PRI  NI ADDR SZ WCHAN  TTY          TIME CMD
4 S     0     1     0  0  80   0 - 29910 -      ?        00:00:04 systemd
1 S     0     2     0  0  80   0 -     0 -      ?        00:00:00 kthreadd
1 S     0     4     2  0  60 -20 -     0 -      ?        00:00:00 kworker/0:0H
...
Something more:
- Understanding Linux Process States- See document from RedHat
- Signals- See Signals of Linux
- Zombie process - See Wiki